
A-LAEF map products
New ALARO - Limited Area Ensemble Forecasting (A-LAEF) high-resolution ensemble prediction system has been recently announced. We have been developing this system within the Regional Cooperation for numerical weather modeling on Limited Area in Central Europe (RC LACE). You will find a detailed description of A-LAEF here.
We are proud to announce that the A-LAEF map products for Slovakia are already available for general public on our website. There are actual forecasts of atmospheric precipitation, cloud cover, air temperature, wind speed and direction, as well as probability maps for different (preselected) thresholds of precipitation and wind gusts. More information on published products can be seen below.
There are three types of map products on the A-LAEF website of SHMU:
- four maps showing the ensemble mean, the ensemble spread, and the minimum and maximum of the ensemble
This product is available for total precipitation, cloud cover, temperature at a height of 2 m above the model surface and wind at a height of 10 m above the model surface (standard meteorological levels). The ensemble average refers to the most probable scenario of weather evolution. However, account must also be taken of the ensemble spread, which determines how well the situation is predictable. The higher the dispersion of the values of a given meteorological field, the greater the uncertainty of such a prediction (and vice versa). In extreme weather events (e.g. intense precipitation, strong wind gusts) or for typically less predictable fields like cloud cover (especially for several days ahead), the spread is usually high (see red regions in the spread of precipitation in Fig. 1). The minimum and maximum of the ensemble then represent extreme (very unlikely, but still possible) development scenarios.
- four maps showing the probability of occurrence of a given phenomenon for different threshold values
This product is available for total precipitation and wind gusts. The threshold values are ad hoc selected to represent limits for different intensities of precipitation and wind gusts. The values gradually increase from the first map (top left) to the last map (bottom right). The first (lowest) value represents the probability of occurrence of the phenomenon as such - the total precipitation of at least 0.1 mm/3h, or wind gusts with a speed of at least 12 m/s. Other threshold values roughly represent the levels at which meteorological warnings are usually issued. However, it should be noted that this is only one of several inputs on the basis of which the meteorologist in the service issues warnings. High probabilities for higher thresholds do not necessarily mean the need for issuing a warning, this is always up to the meteorologist’s decision. An example of a probabilistic wind gust prediction is shown in Fig. 3.
- a matrix of 16 maps showing various forecast scenarios of individual A-LAEF ensemble members
This product is only available for total atmospheric precipitation. The uncertainty in the precipitation forecast is in most cases relatively large, especially for longer lead times. In such situation, it can be very useful to look at the individual prediction scenarios. This way we can get additional information to the aggregated values from the first and second types of maps.

Fig 1. Total precipitation forecast (mm/3h) valid on July 6 between 21 and 24 UTC. The top left panel shows ensemble mean, the top right is ensemble spread, the bottom left panel shows minimum of ensemble and the bottom right is maximum of ensemble. At the same time, the maps also show mean sea level pressure (isobars of 2 hPa) and the wind direction (arrows) of the control non-perturbed A-LAEF run valid at 24 UTC.
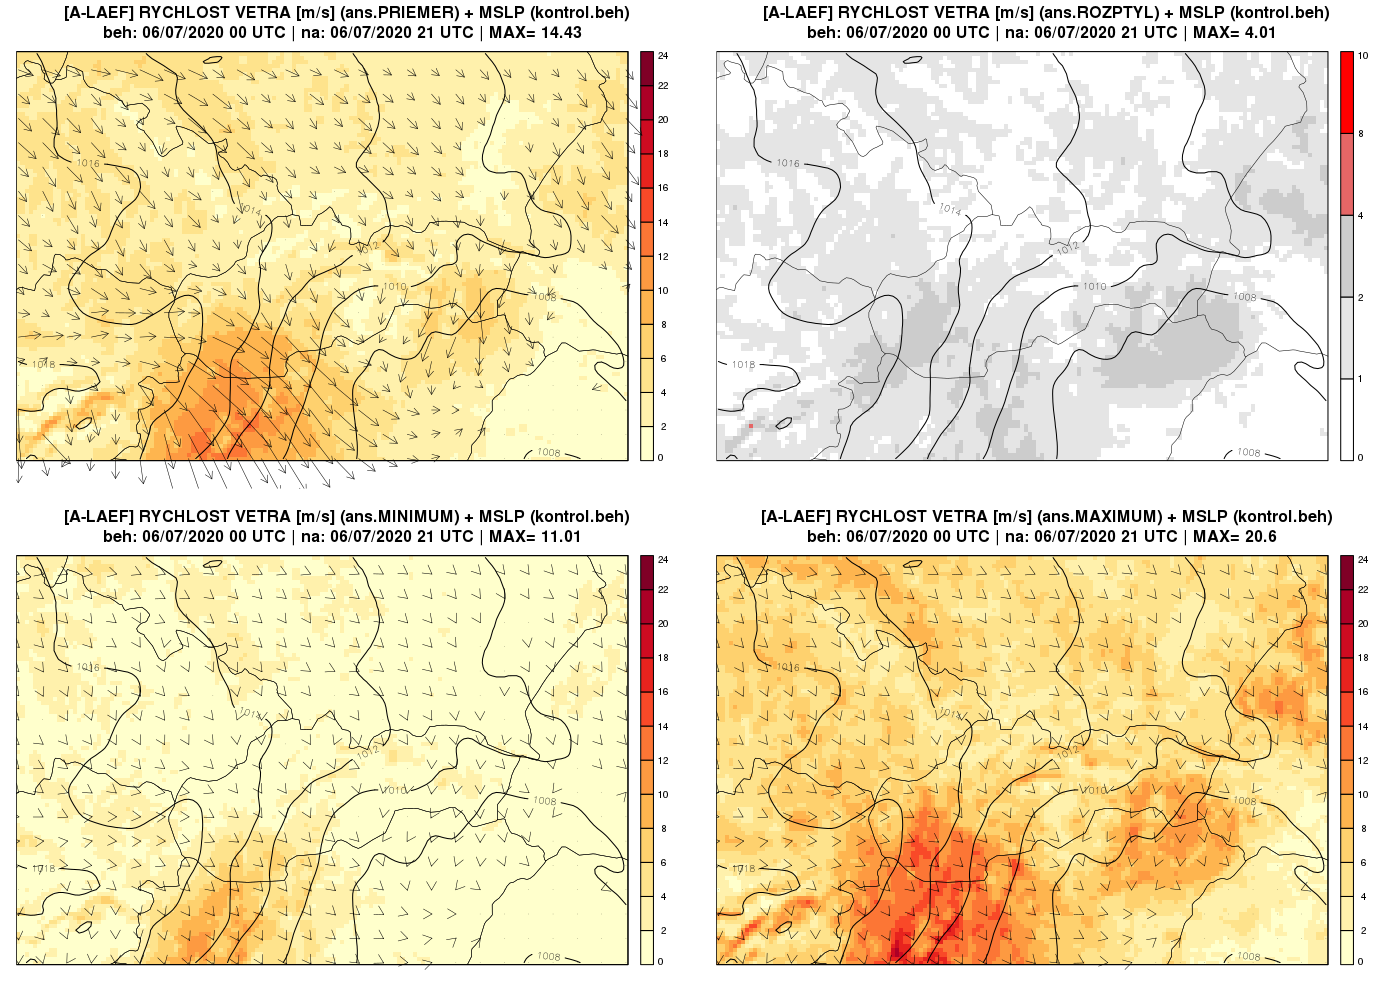
Fig 2. Wind direction and speed (m/s) forecast valid on July 6 at 21 UTC. The top left panel shows ensemble mean, the top right is ensemble spread, the bottom left panel shows minimum of ensemble and the bottom right is maximum of ensemble. At the same time, the maps also show mean sea level pressure (isobars of 2 hPa) of the control non-perturbed A-LAEF run.
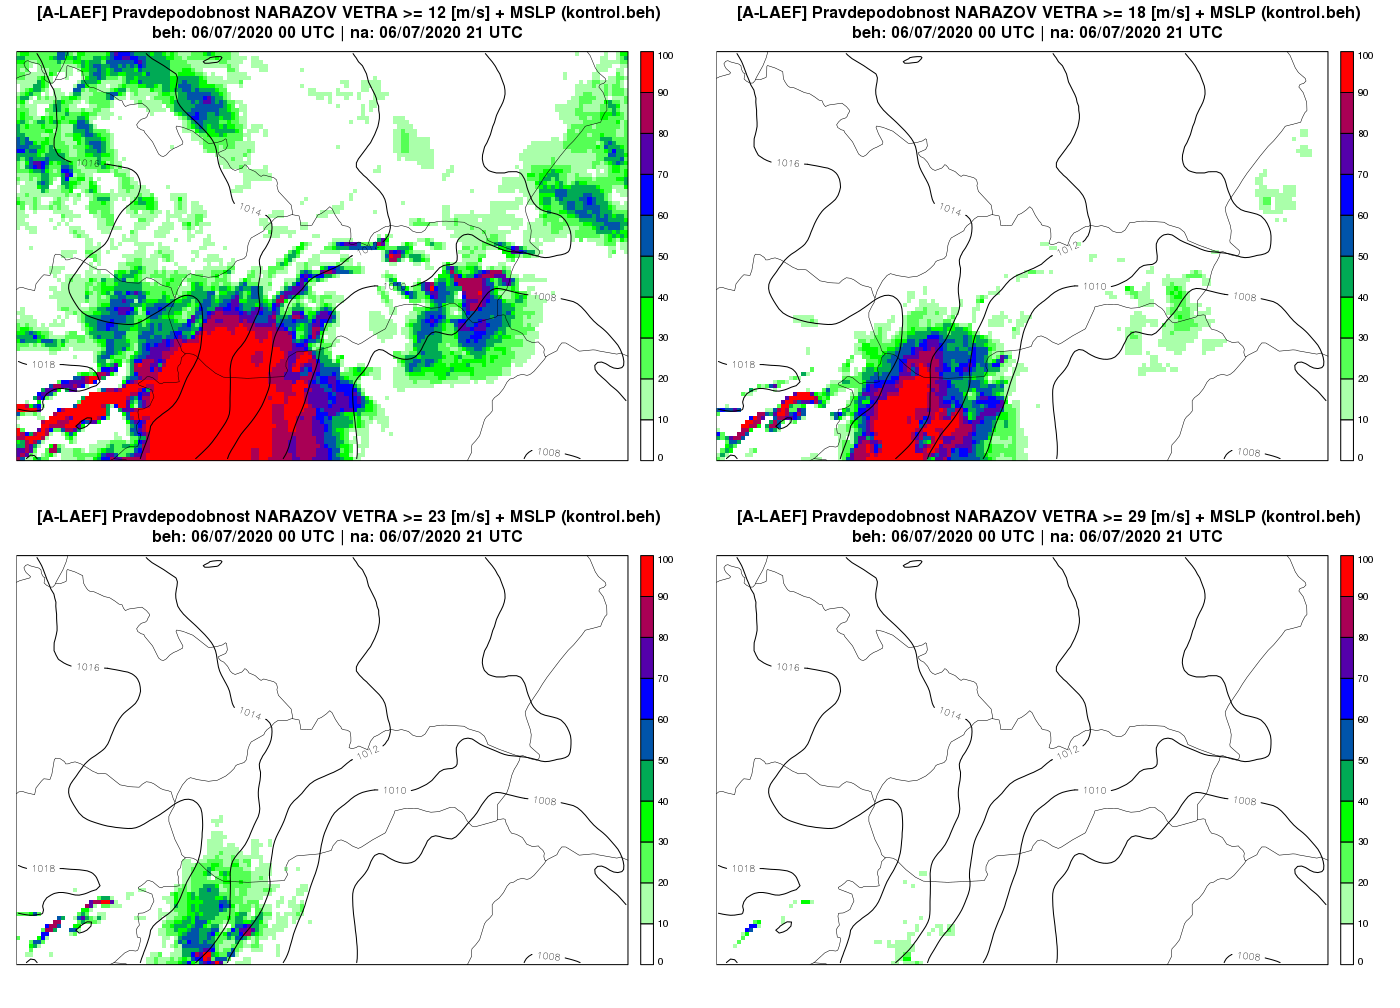
Fig 3. Probability of wind gusts (%) valid on July 6 at 21 UTC for various thresholds. Top left panel shows probability of wind gusts of at least 12 m/s, top right of at least 18 m/s, bottom left more than 23 m/s inclusive and bottom right probability of gusts exceeding 29 m/s inclusive. At the same time, the maps also show mean sea level pressure (isobars of 2 hPa) of the control non-perturbed A-LAEF run.
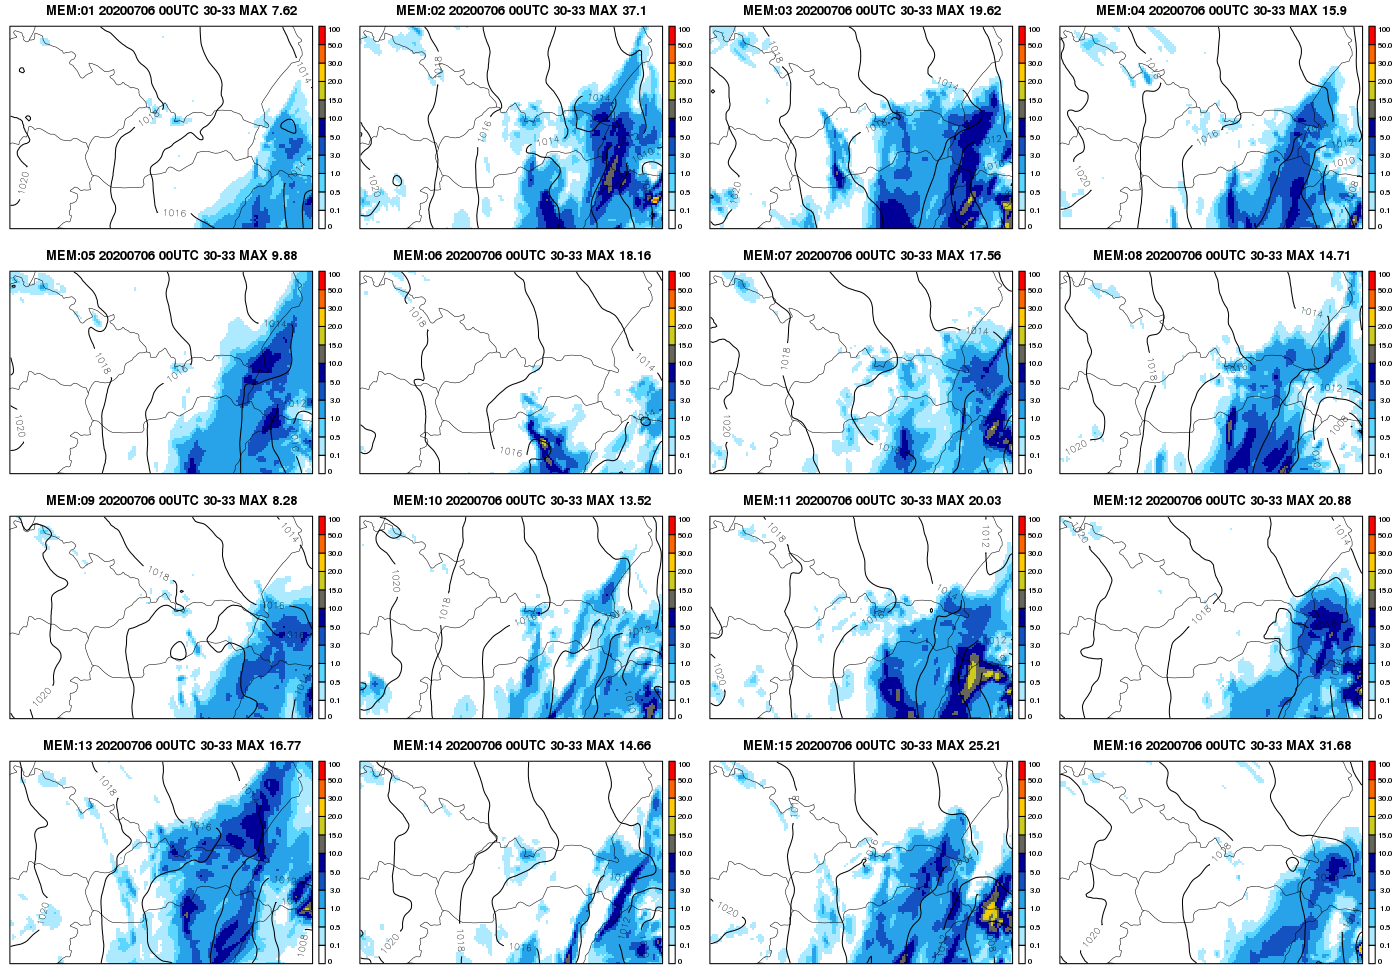
Fig 4. Total precipitation forecast (mm/3h) from July 6, 00 UTC for 30 to 33 hours in advance for individual A-LAEF ensemble members. From the upper left corner from the 1st member of the ensemble to the 16th member of the ensemble in the lower right corner. At the same time, the maps also show mean sea level pressure forecast for +33 hours (isobars of 2 hPa) for a given member of the A-LAEF ensemble