
Example of climatological data processing from meteorological station Telgárt
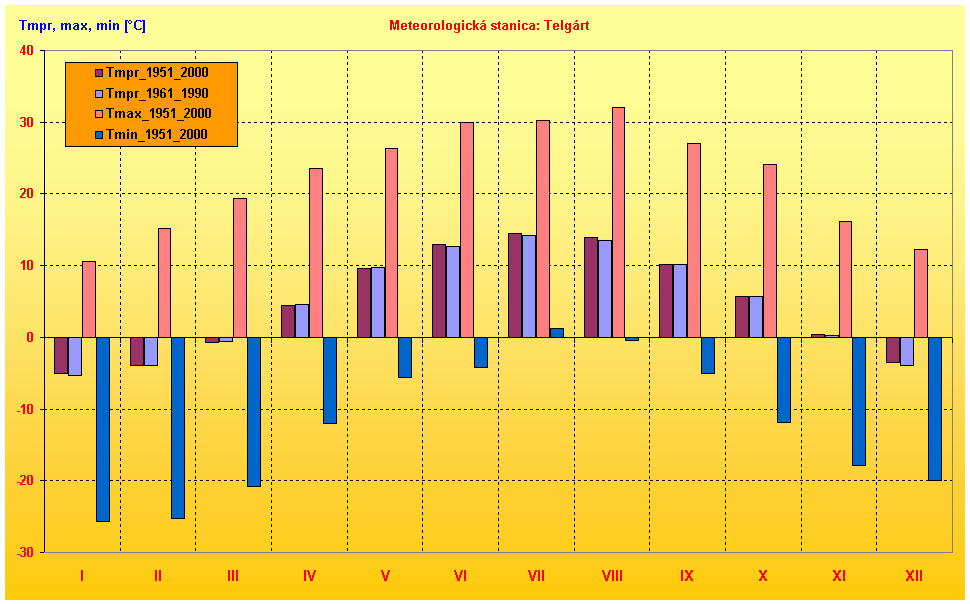 Fig. 1 - Annual mode of average, maximum and minimum air temperature (Tmpr, Tmax and Tmin) at the meteorological station Telgárt (901 m) in the period 1951-2000, respectively 1961-1990 |
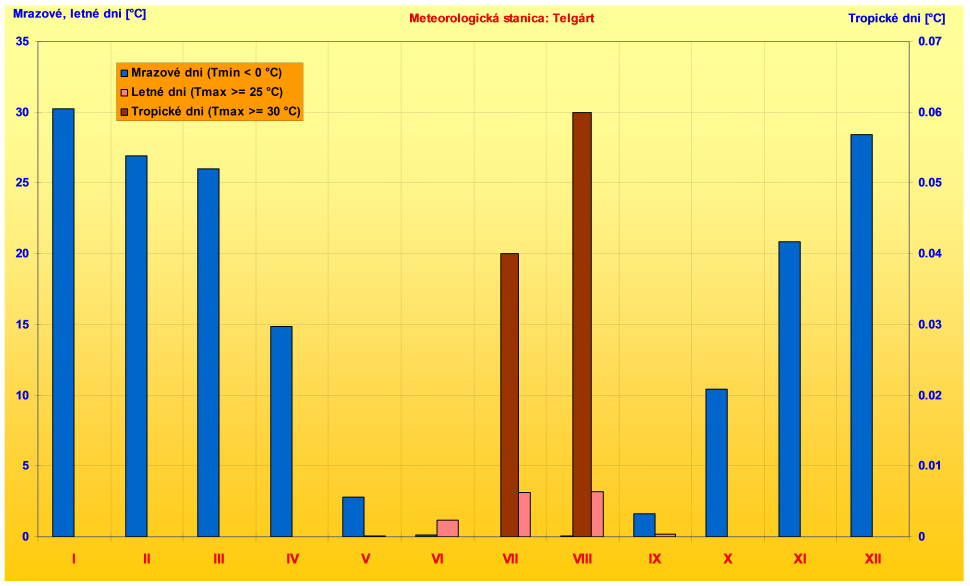 Fig. 2 - The annual frequency mode of frost, summer and tropical days at the meteorological station Telgárt (901 m) in the period 1951-2000 |
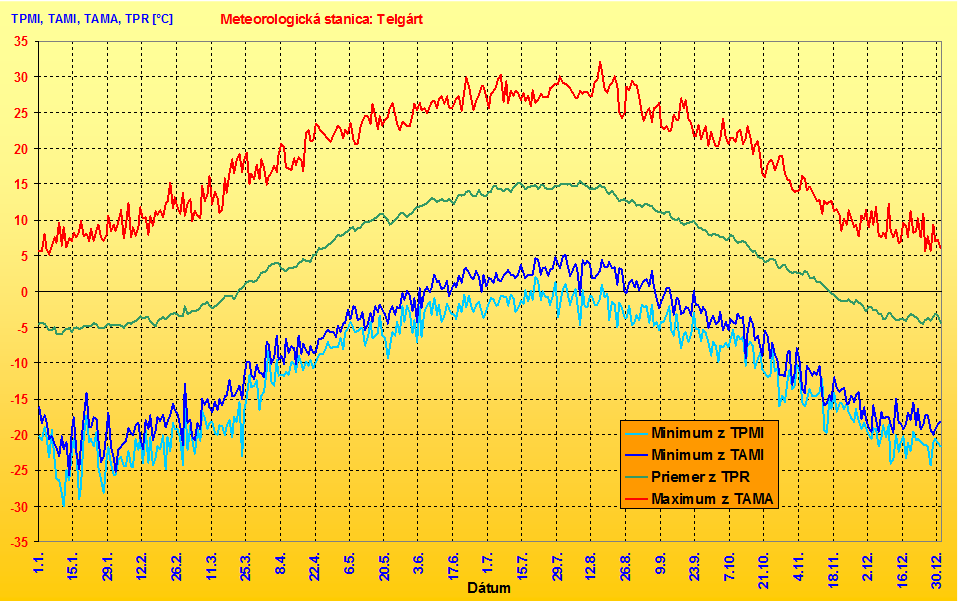 Fig. 3 - The annual regime of selected characteristics of daily temperature for the meteorological station Telgárt (901 m) in the period 1951-2000 (TPMI - ground floor a minimum daily air temperature at 5 cm on the surface; TAMI - the minimum daily air temperature at 2 m above Earth, TAMA - the daily maximum air temperature, TPR - the daily average temperature, in ° C) |
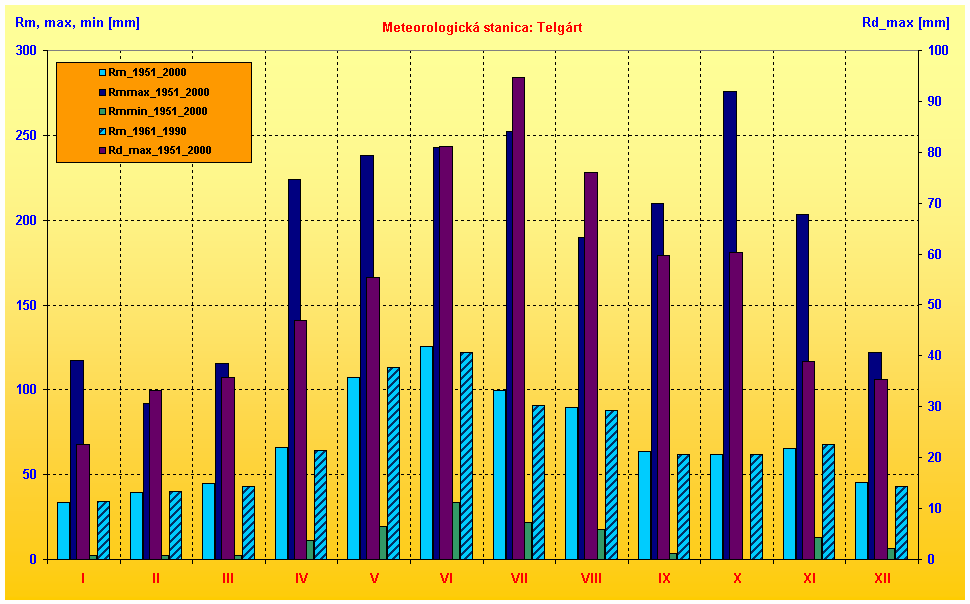 Fig. 4 - The annual regime of selected features of monthly precipitation for the meteorological station Telgárt (901 m) in the period 1951-2000, respectively 1961-1990 (Rm - the average monthly rainfall; Rmmax - maximum monthly precipitation; Rmmin - minimum monthly precipitation; Rd_max - the maximum monthly precipitation in mm) |
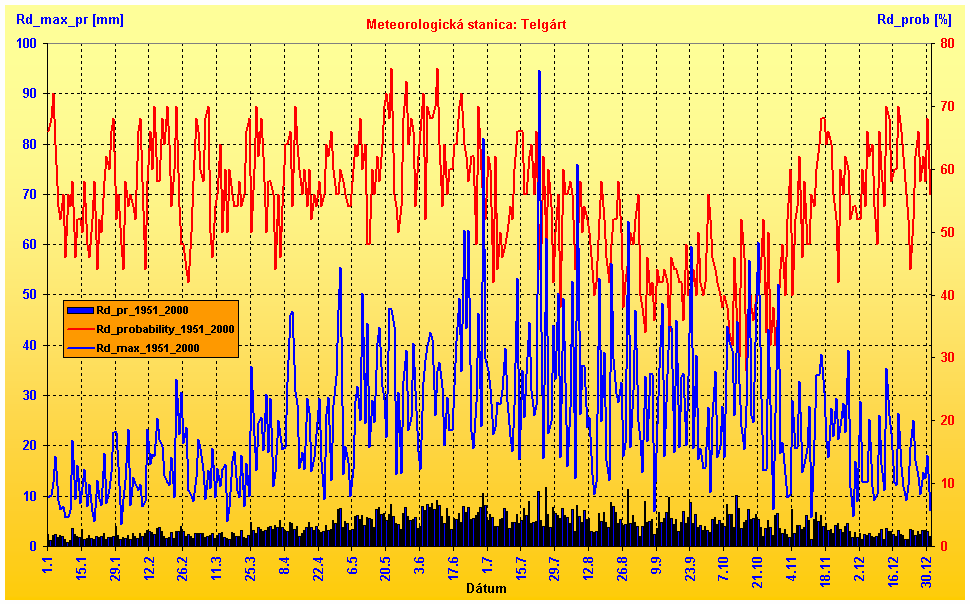 Fig. 5 - The annual regime of selected characteristics of daily precipitation for meteorological station Telgárt (901 m) in the period 1951-2000 (Rd_pr - the average daily precipitation [mm]; Rd_max - the maximum daily precipitation [mm]; Rd_prob - the probability of rainfall for the day [%]) |
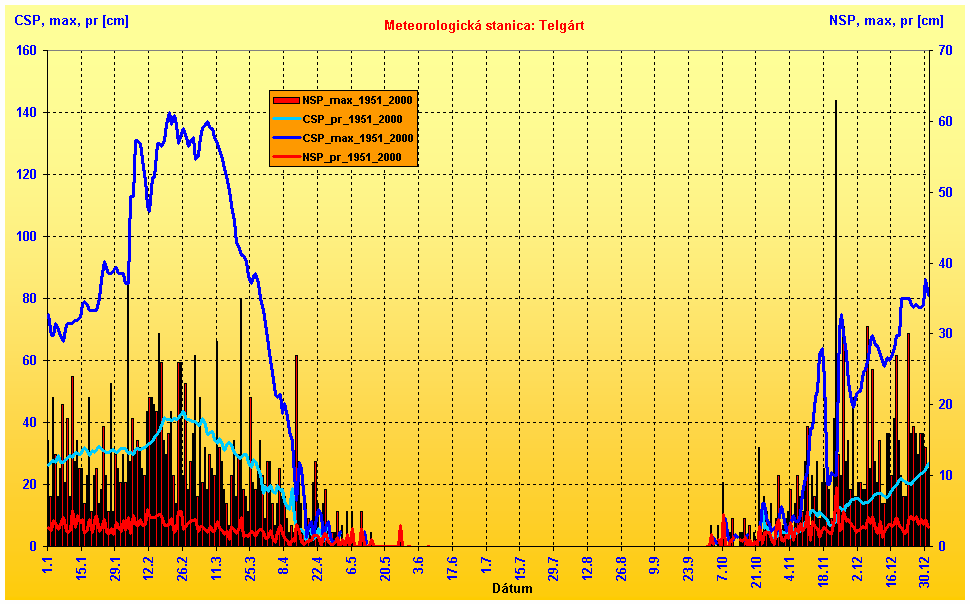 Fig. 6 - Annual regime of selected daily snow characteristics at the meteorological station Telgárt (901 m) in the period 1951-2000 (NSP_max - the maximum amount of new snow depth [cm]; NSP_pr - the average amount of new snow depth [cm]; CSP_max - maximum total amount of snow cover [cm]; CSP_pr - average total amount of snow [cm]) |
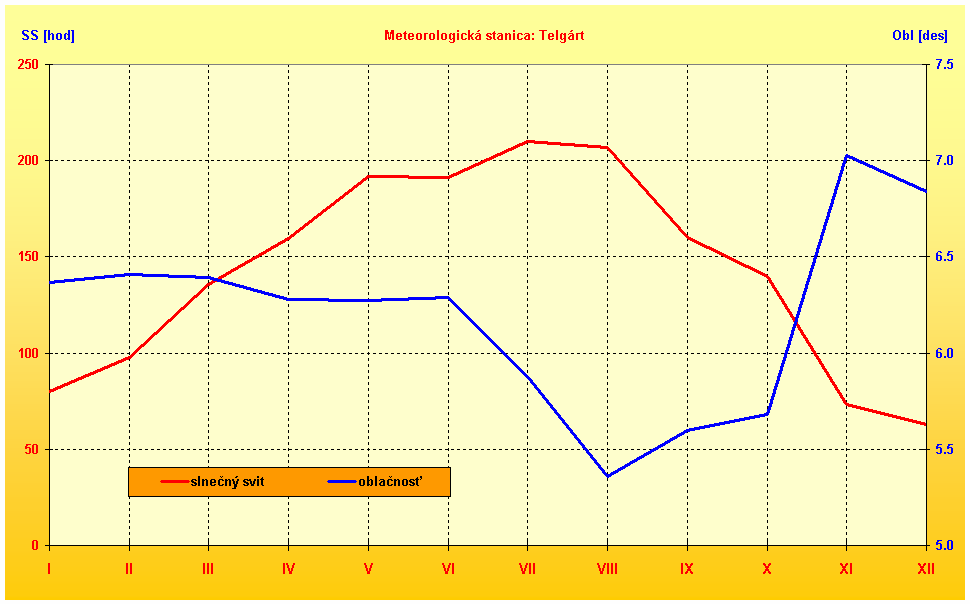 Fig. 7 - Annual regime of average monthly cloud (obl) and monthly sum of sunshine (SS) at the meteorological station Telgárt (901 m) in the period 1951-2000 |
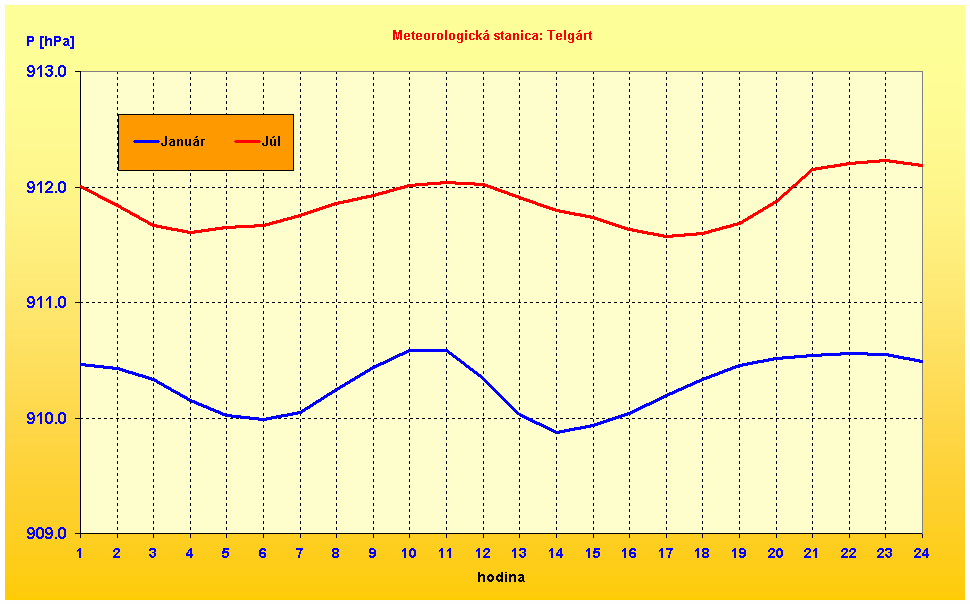 Fig. 8 - The daily running of average hourly air pressure P [hPa] at the meteorological station Telgárt (901 m) in the period 1998-2007 |
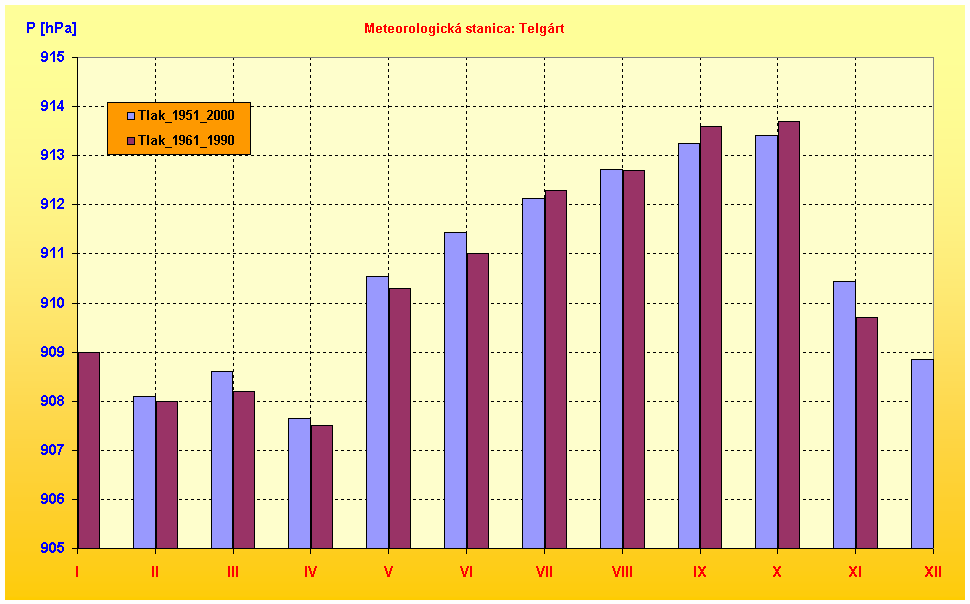 Fig. 9 - The annual running of the average monthly air pressure P [hPa] at the meteorological station Telgárt (901 m) in the period 1951-2000, respectively 1961-1990 |
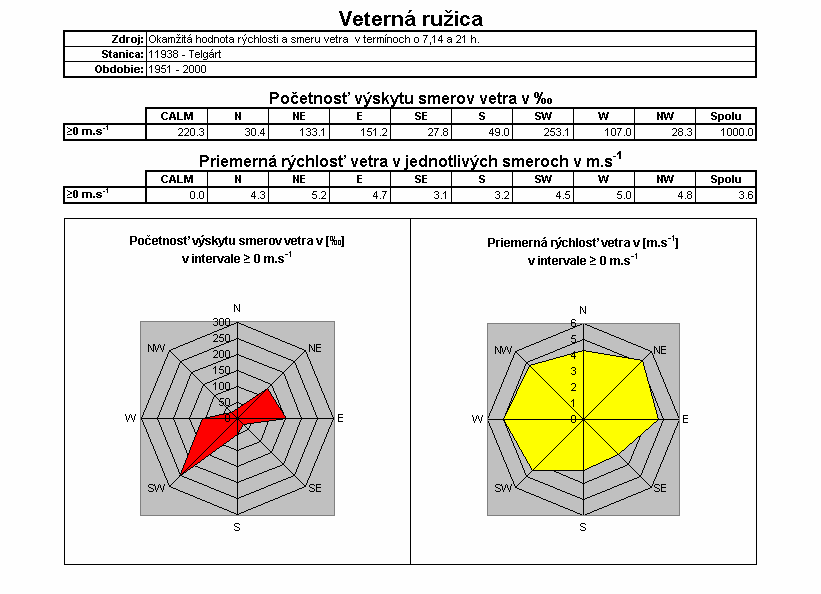 Fig. 10 - Example of tabular and graphic design of average wind speed and direction at the meteorological station Telgárt (901 m) in the period 1951-2000 (Calm - calm, N - north, NE - Northeast, E - East SE - South East, S - South, SW - Southwest, W - West, NW - Northwest) |
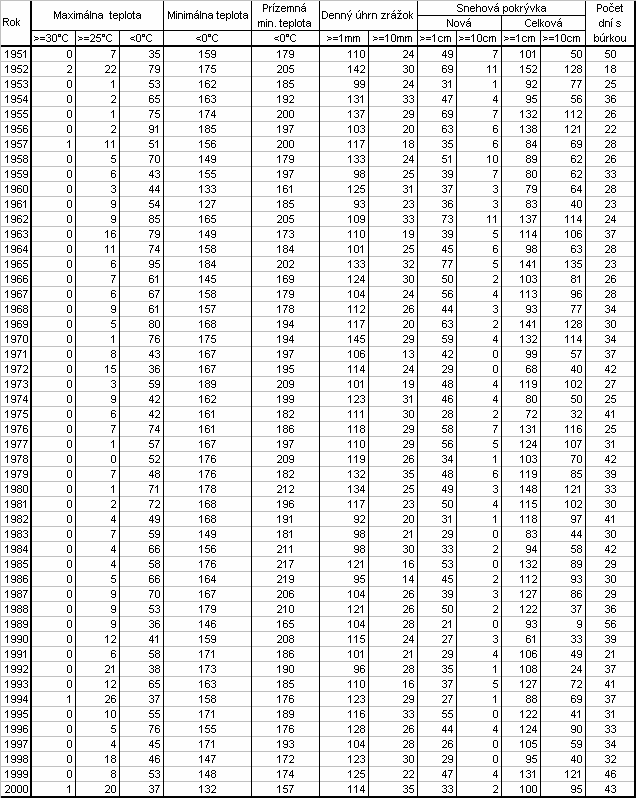 Fig. 11 - Example of tabular processing of annual multiplicity of selected day´s characteristics (eg, Tmax ≥ 30 ° C, ≥ 25 ° C, <0 ° C, etc.) at the meteorological station Telgárt (901 m) in the period 1951-2000 |